NAOS
indoor, metal, MultiLumen
| Code | Type | Luminous flux of LED modules [lm] |
Luminous flux of light fitting: [lm] |
Power consumption: [W] |
System efficacy: [lm/W] |
Net weight: [kg] |
A [mm] |
D [mm] |
|
|---|---|---|---|---|---|---|---|---|---|
| 95020 | NAOS 1.2ft 1600/840 | 1630 | 1320 | 10,5 | 126 | 2,0 | 620 | 470 | |
| 95050 | NAOS 1.4ft 3200/840 ML | 3260 | 2640 | 20,1 | 131 | 3,7 | 1180 | 1030 | |
| 95080 | NAOS 1.5ft 4000/840 ML | 4180 | 3390 | 25,3 | 134 | 4,4 | 1460 | 1310 | |
| 95110 | NAOS 2.2ft 3200/840 | 3250 | 2700 | 20,1 | 134 | 2,6 | 620 | 470 | |
| 95140 | NAOS 2.4ft 6400/840 ML | 6520 | 5410 | 38,4 | 141 | 4,6 | 1180 | 1030 | |
| 95170 | NAOS 2.5ft 8000/840 ML | 8330 | 6910 | 48,3 | 143 | 5,5 | 1460 | 1310 | |
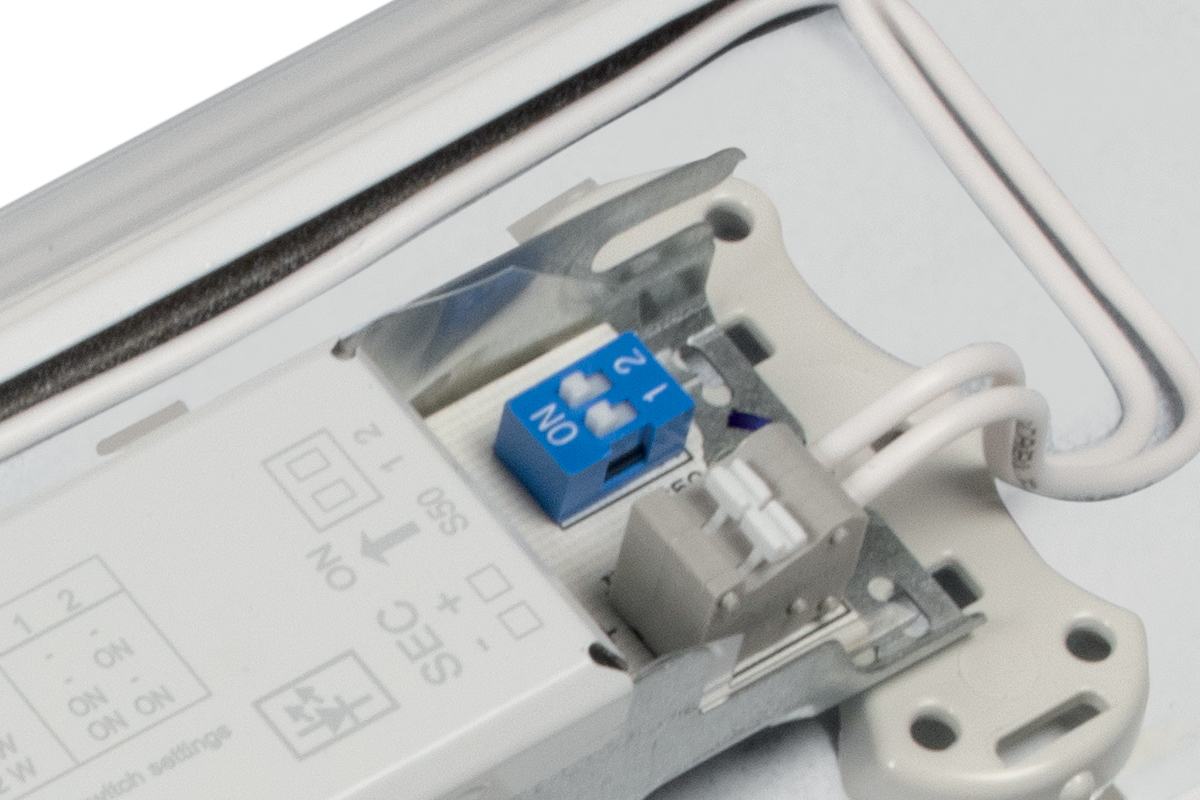
- MultiLumen (ML) function enables simple switching between up to four luminous fluxes via driver's DIP switch.
Technical data
- System efficacy: 143 lm/W
- Degree of protection: IP40
- Minimum ambient temperature: ta = -25 °C
- Maximum ambient temperature: ta = 35 °C
- Minimum ambient temperature: ta = 0 °C version with emergency back-up source
- Maximum ambient temperature: ta = 35 °C version with emergency back-up source
- Life time: 50000 hours / L90/B10
- Unified Glare Ratio (UGR) from 24,2 to 25
- Impact strength: IK02
- Chromaticity tolerance (initial MacAdam): SDCM3
- Certification CE
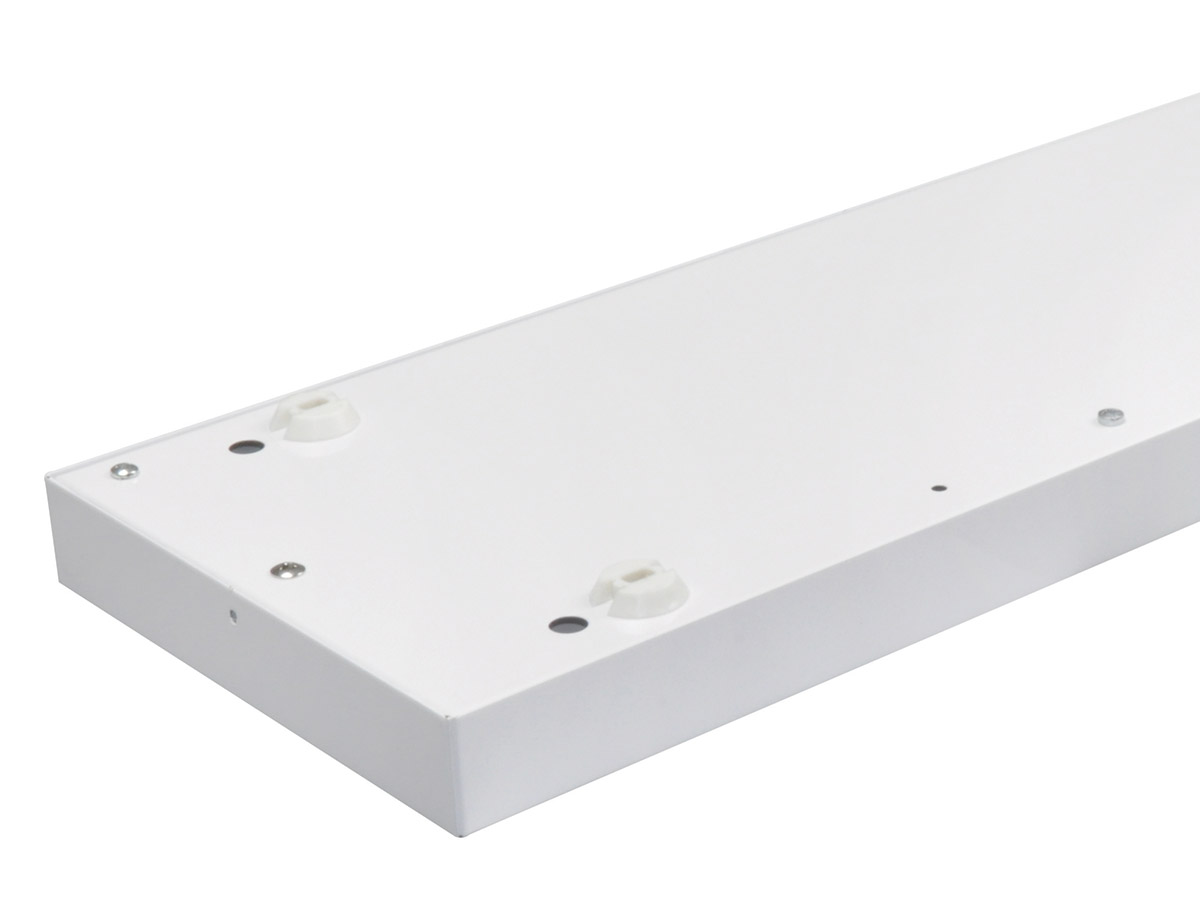
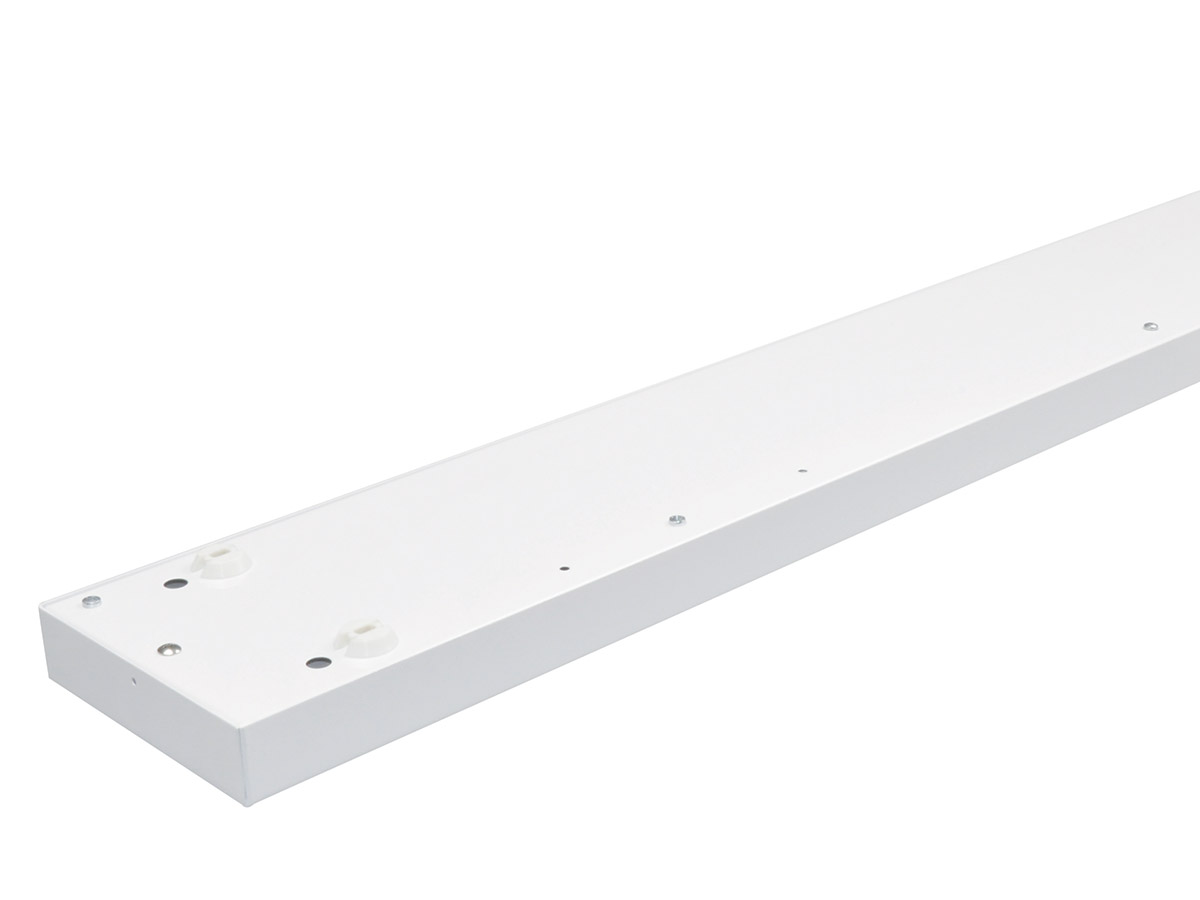
Attachment method
- Suitable for suspended mounting
- Suitable for ceiling mounting
- Suitable for wall mounting
- Suitable for surface mounting
Materials / finishes
- Body: Steel sheet, white (RAL 9003), Steel sheet, aluminium silver colour (RAL 9006)
- Diffuser: Acrylic (PMMA), sandblasted from both sides
- Connection: Screwless five-pole terminal block, Screwless seven-pole terminal block
- Cable glands: rubber
Electric equipment
- It can be delivered in emergency version
- It can be delivered in dimmable version
Download
Click the relevant product code in the table above to access the EULUMDAT (.ldt) files and the installation instructions for your luminaire.
BIM
Download the BIM objects.
More about BIM at bim.lighting.
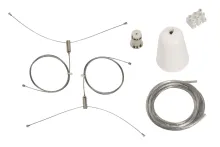
Accessories to NAOS
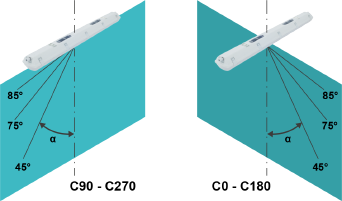
Drawings and graphs of luminosity

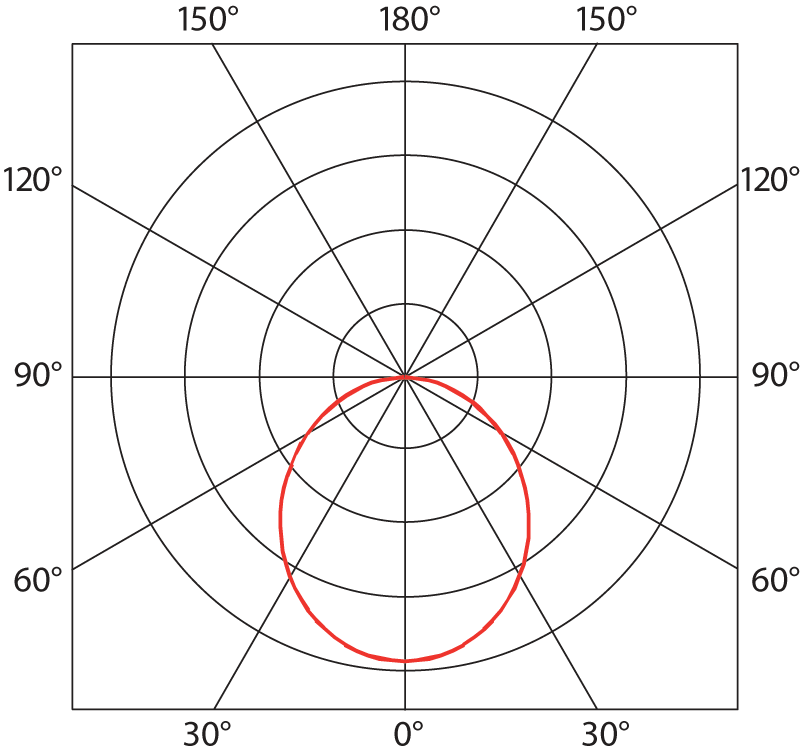
Nothing you say?
Check out instructions in which we explain what can be read from these graphs.
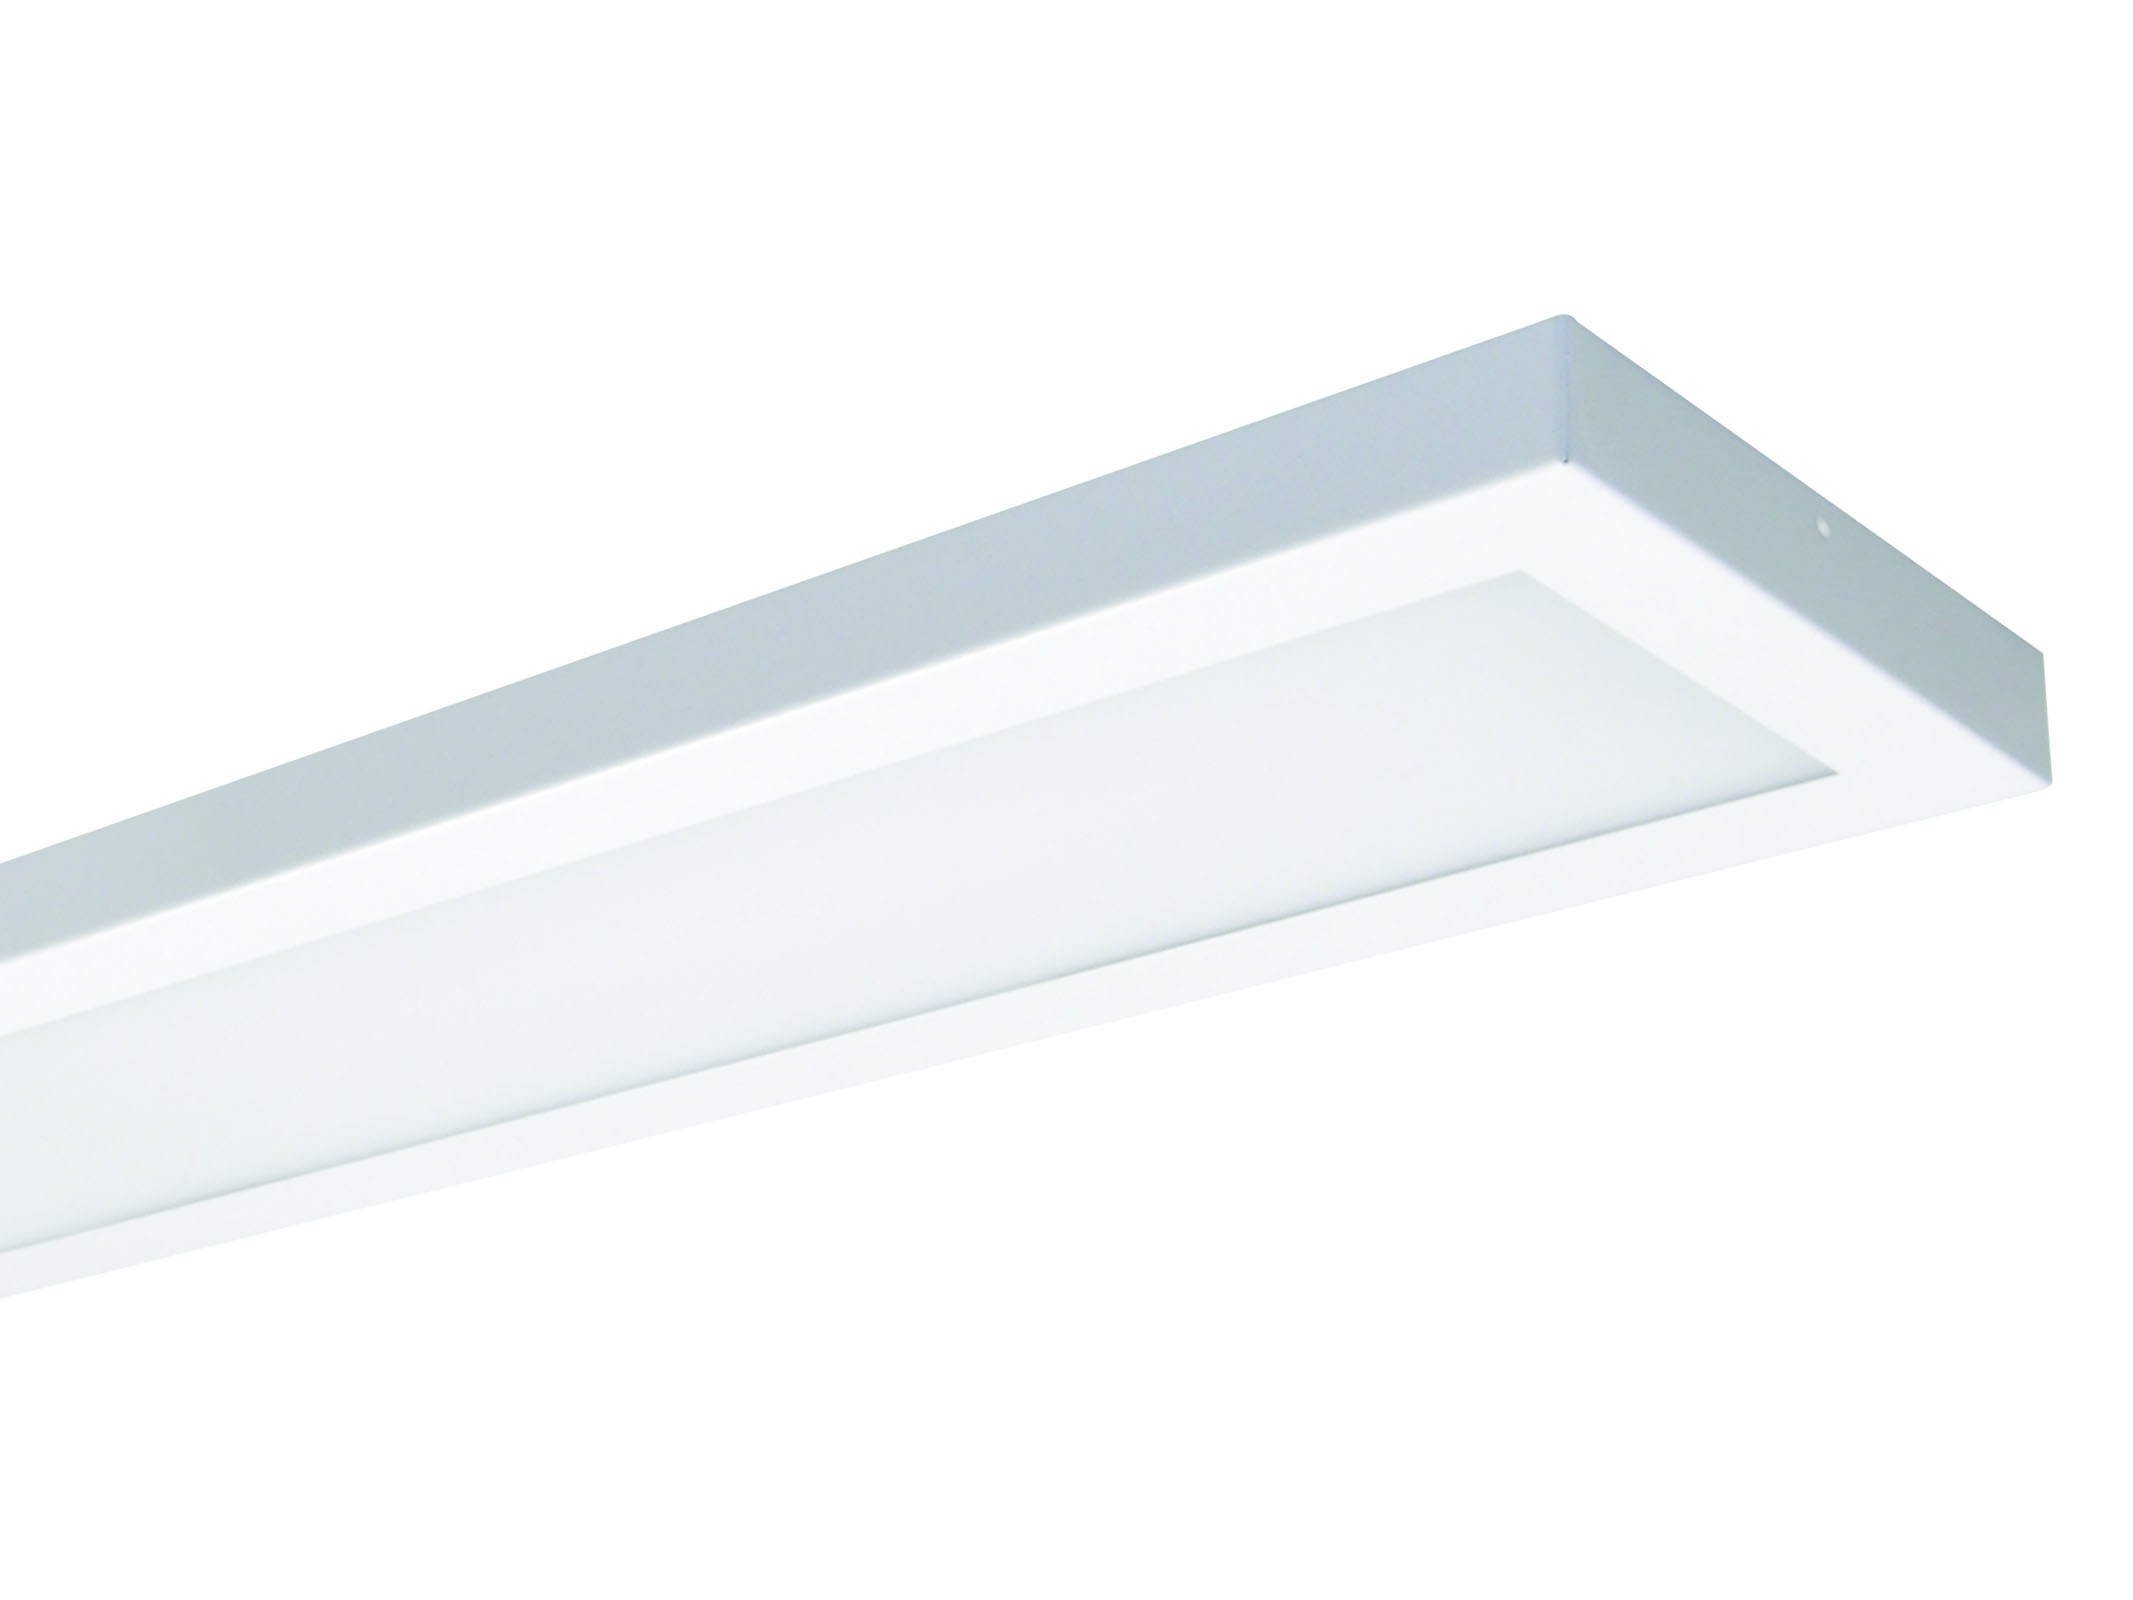
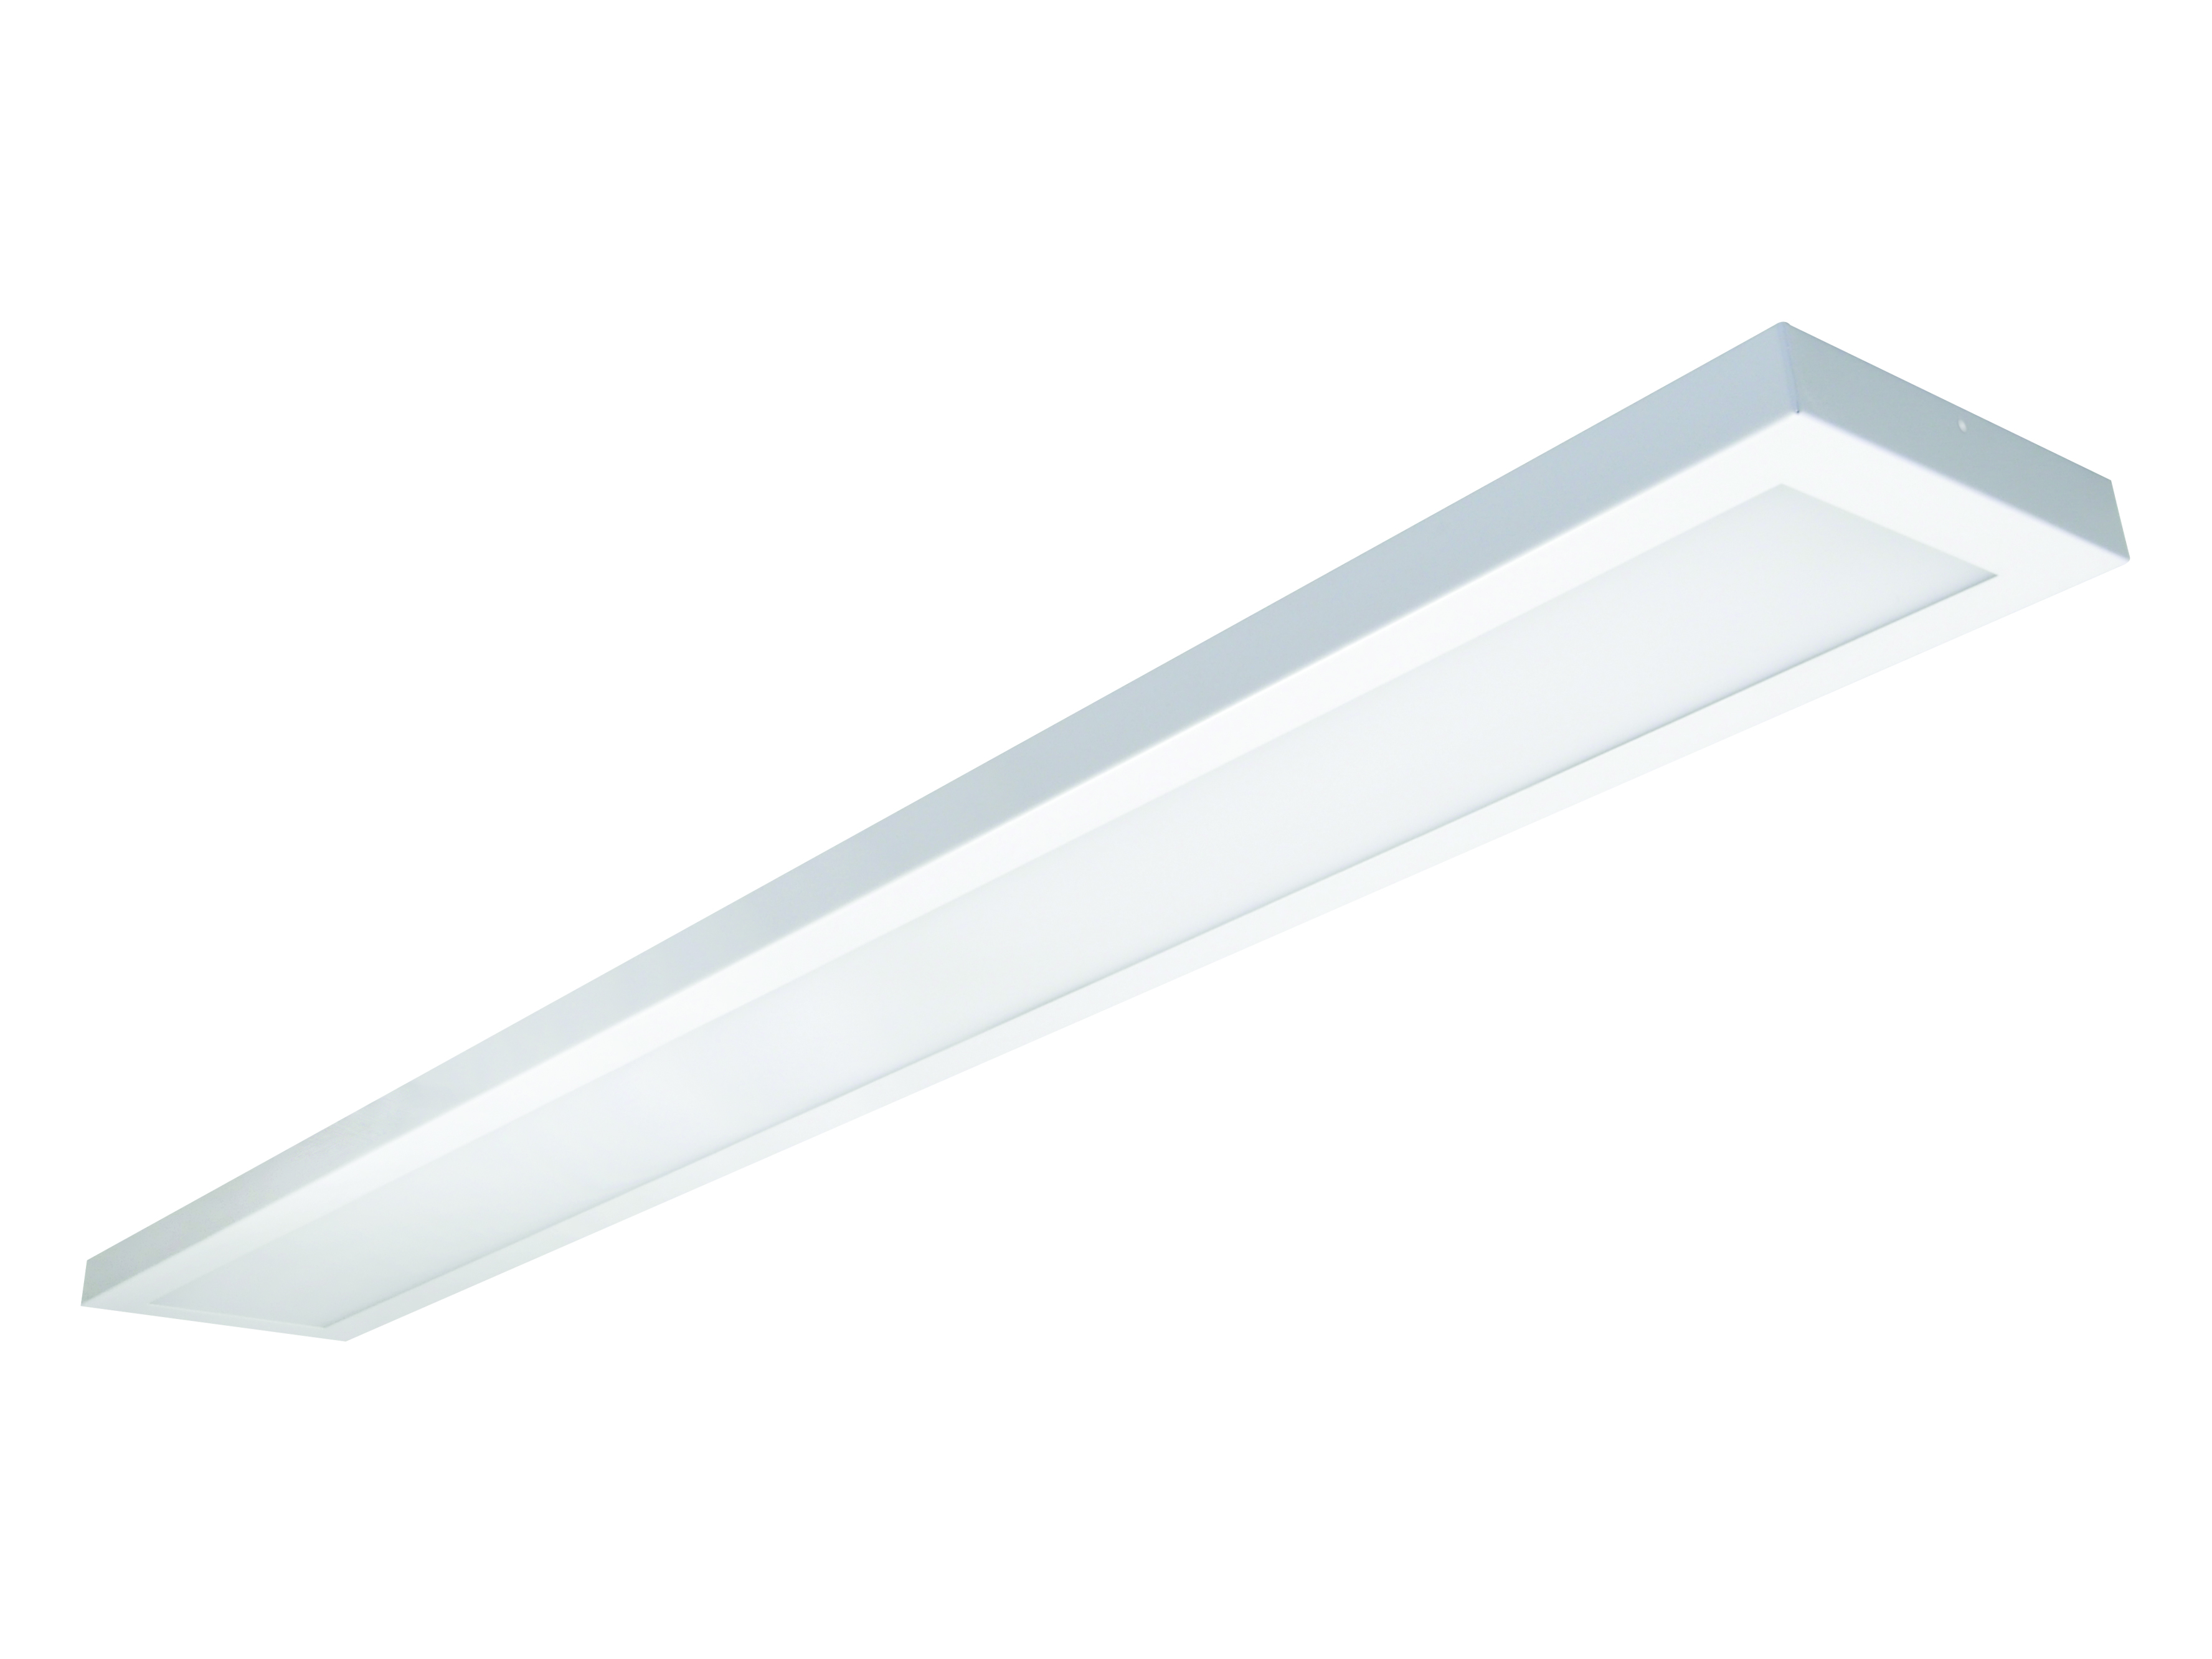
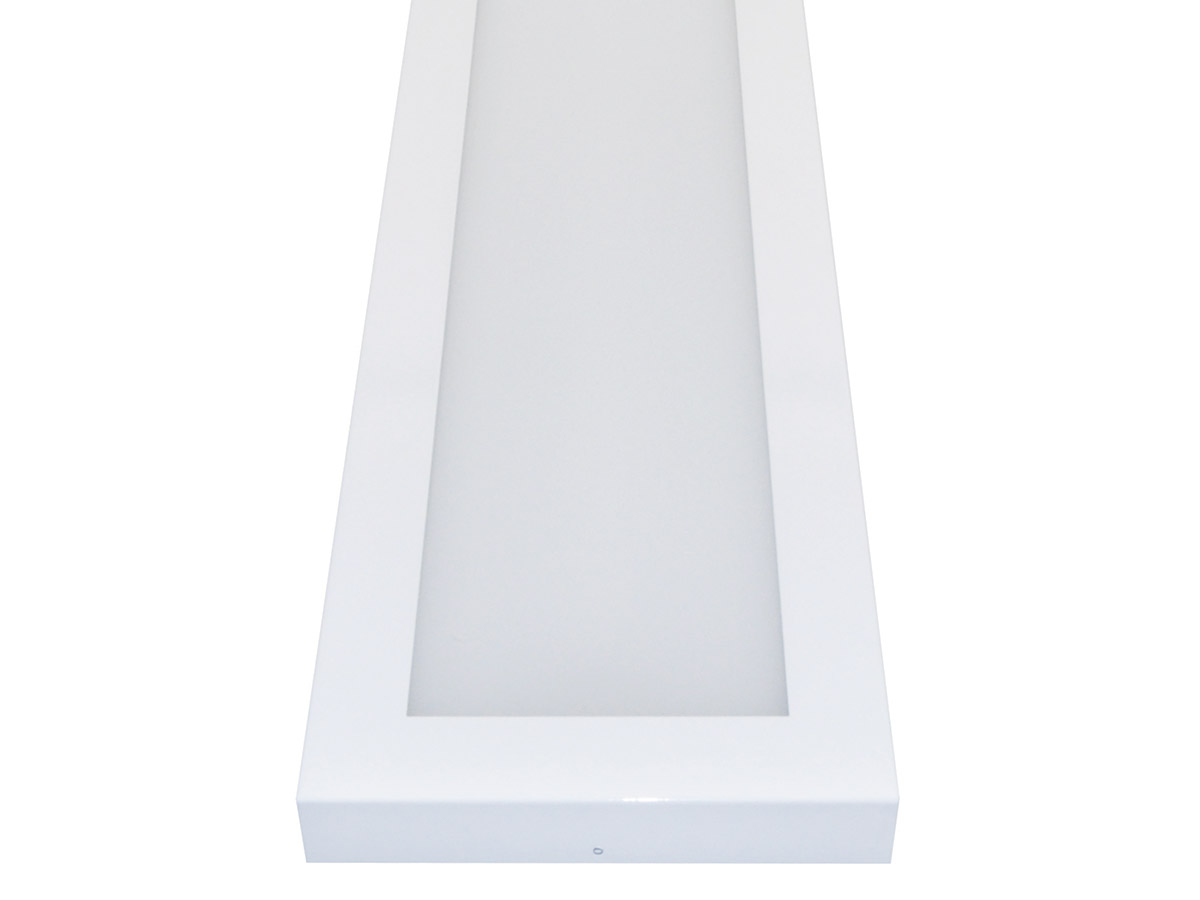
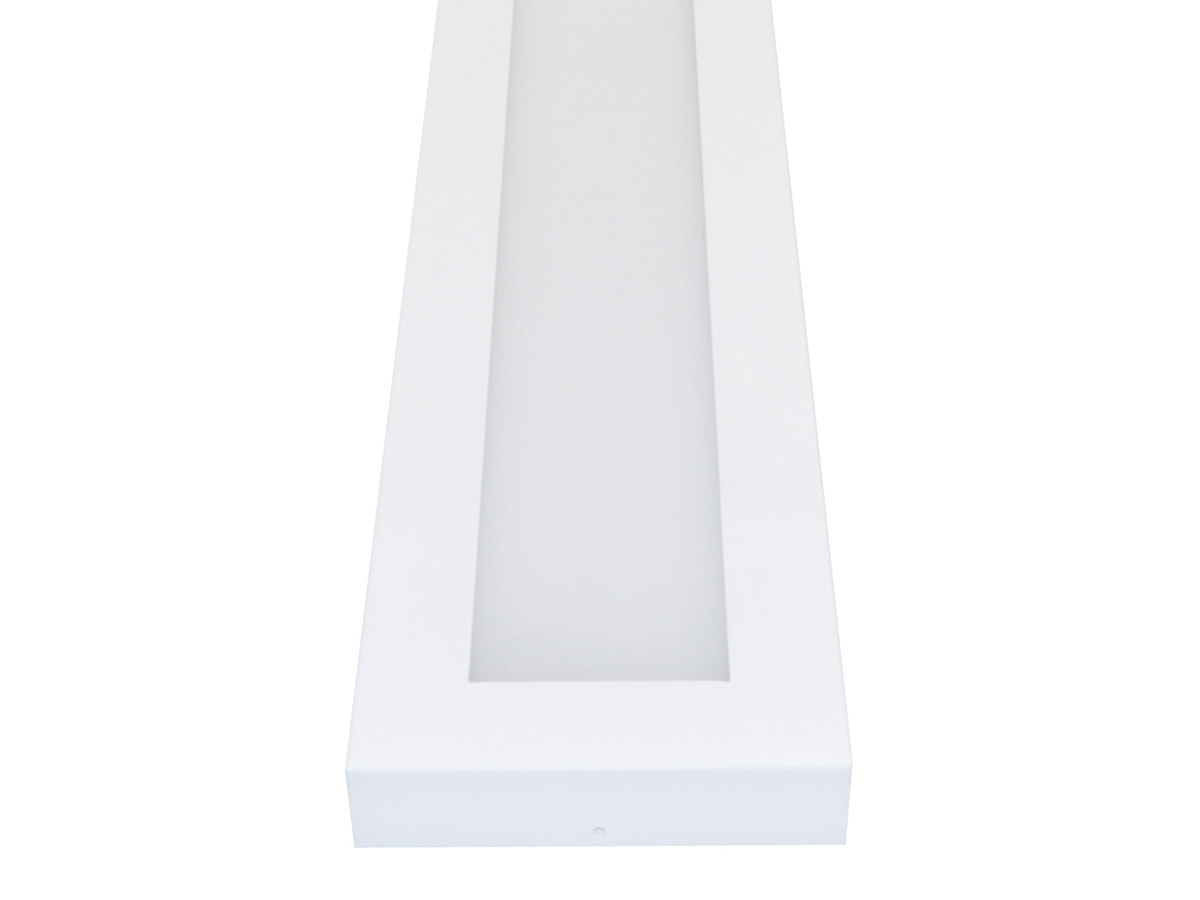
Metal indoor LED light fitting for suspension or surface-mounted installation on the ceiling, with base made of steel sheet and diffuser made from sandblasted opalised acryl.
Thanks to the MultiLumen function, the luminaire can be adjusted for changing lighting requirements without much effort.
Advanced lamp with low profile of total height of 34 mm only.
The light fitting is suitable for offices, hallways, school interiors, libraries, lecture rooms, sanitary rooms, hospitals and passenger terminals.